2026 Mid-Year Outlook – Between Shock and Stability
2026 Mid-Year Outlook – Between Shock and Stability
Between Shock and Stability
Introduction:
So far in 2026, markets have been defined by resilience, not stability. Over the last six months, they navigated a remarkable series of shocks related to the war in Iran, commodity price swings, sticky inflation, volatile policy expectations, and a reconfiguration of global supply chains. Despite these pressures, market fundamentals held up better than many anticipated. Support came from steady growth in the U.S. economy, strong corporate earnings, relentless AI-related spending, and ongoing fiscal stimulus. Now, in the space between shock and stability, the danger for investors lies in mistaking market resilience for genuine tranquility.
Looking forward, with U.S. midterm elections on the horizon, several forces are set to shape market direction. Investors are keeping an eye on the rapid evolution of AI and its burgeoning effects on the real economy. Meanwhile, central bank leaders remain divided on the path for interest rates. Geopolitical fragmentation continues to reshape global trade and capital flows, and credit spreads are historically tight. Given these crosscurrents, there will likely be many catalysts to monitor in the months ahead.
As we enter midyear, it is important to step back and reflect. Putting recent headlines into perspective is critical, especially in an environment where short-term noise can obscure long-term trends. As long-term investors, we recognize that maintaining the trust you place in us is our most essential responsibility. With that in mind, we look back on the year to date and outline our expectations for what’s ahead.
The Rise of Economic Fragmentation:
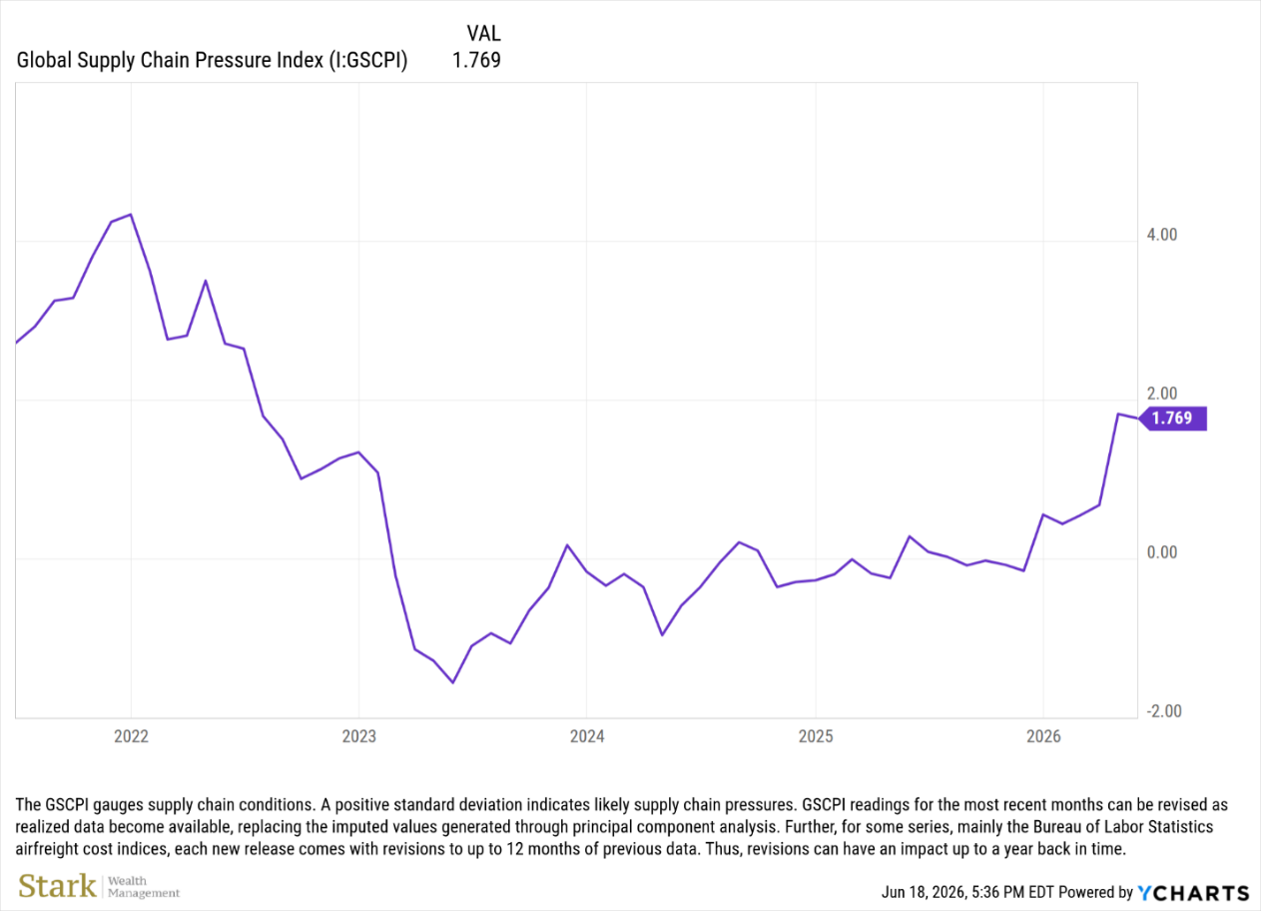
Recent geopolitical tensions are accelerating fragmentation amongst global economies. In the aftermath of the COVID-19 pandemic, many governments shifted to prioritize energy security, domestic industrial capacity, and diversified supply chains over market efficiency. Under this new framework, individual markets are more sensitive to demand and supply chain shocks. Reshoring, tariffs, supply chain duplication, and high defense spending all contribute to rising costs across the globe, and the increased supply chain pressures brought on by regionalization are directly linked to structural inflation. This suggests an investment landscape in which geopolitics carries a steeper risk premium for the near future. The global fragmentation trend is likely to continue, and we expect to see divergences widen with strategically important sectors benefiting from policy support, while globally exposed, trade-sensitive sectors face pressures.
These expectations underscore the importance of a balanced approach. As individual risk factors increase and combine, it remains our belief that a well-diversified portfolio can handle economic externalities. Large, single bets in any one area of the market are likely to exhibit more rounds of volatility. Staying balanced and diversified across regions and asset classes can help smooth these fluctuations, benefiting from market resilience over time. We believe that a disciplined, long-term perspective remains one of the most reliable ways to compound returns and navigate uncertainty. Despite a more fragmented global economic backdrop, markets still reward patience over prediction.
Supply Chains Under Strain:
At the start of the year, most analysts (ourselves included) predicted that the global economy would continue its growth trajectory throughout 2026, supported by ongoing monetary and fiscal policy easing and rising real wages. That outlook was quickly tested by a scenario that commodity analysts have long flagged as a risk: conflict in the Middle East leading to the closure of the Strait of Hormuz. This narrow passageway off the south coast of Iran is one of the world’s most critical energy transit routes, and its closure sent shockwaves through global markets almost immediately.
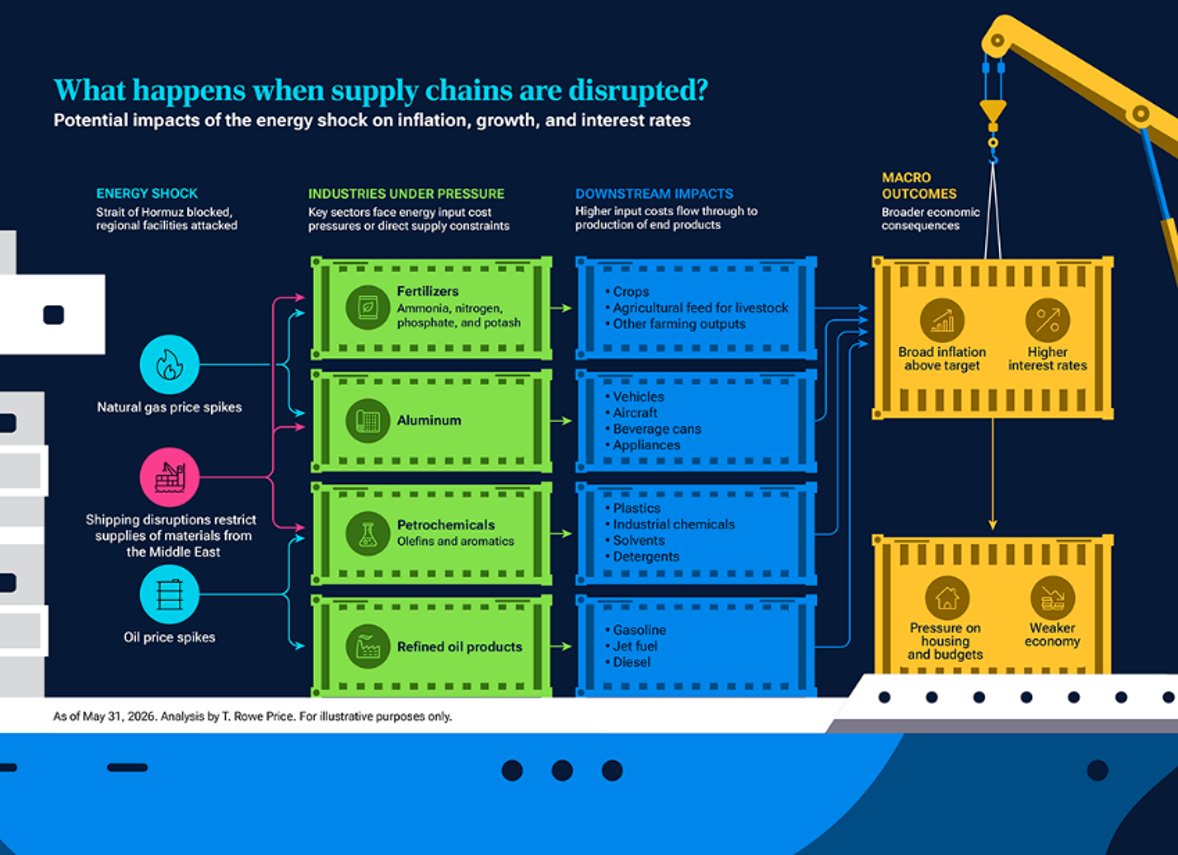
As the conflict between the U.S. and Iran escalated, traffic through the strait nearly halted. Shipping fell from 130 ships per day to a mere 6 ships at the start of the war (UN Trade & Development, 2026). The impact extended well beyond crude oil, affecting nearly everything from fertilizers, aluminum, petrochemicals, and refined oil products. These are critical inputs that feed directly into sectors such as agriculture, manufacturing, transportation, and consumer goods. The result was a rapid bout of volatility, followed by a partial recovery as markets adjusted to new supply-side constraints.
Recent inflation data reflect those pressures. The latest CPI report sets inflation at 4.3% higher than it was last year, with the most pronounced price increases hitting energy and food, up 23.5% and 3.5%, respectively (Bureau of Labor Statistics, 2026). All-in-all, the broader macroeconomic outcome from the closure of the strait is somewhat predictable. We expect that higher input costs will lead to elevated inflation in the near future, which means higher interest rates and increased strain on wages and household budgets. For investors, the long-term implications are yet to be fully realized. We advise patience over prediction and remain committed to helping you navigate an environment shaped by both structural shifts and episodic shocks.
The Hyperscaler Effect:
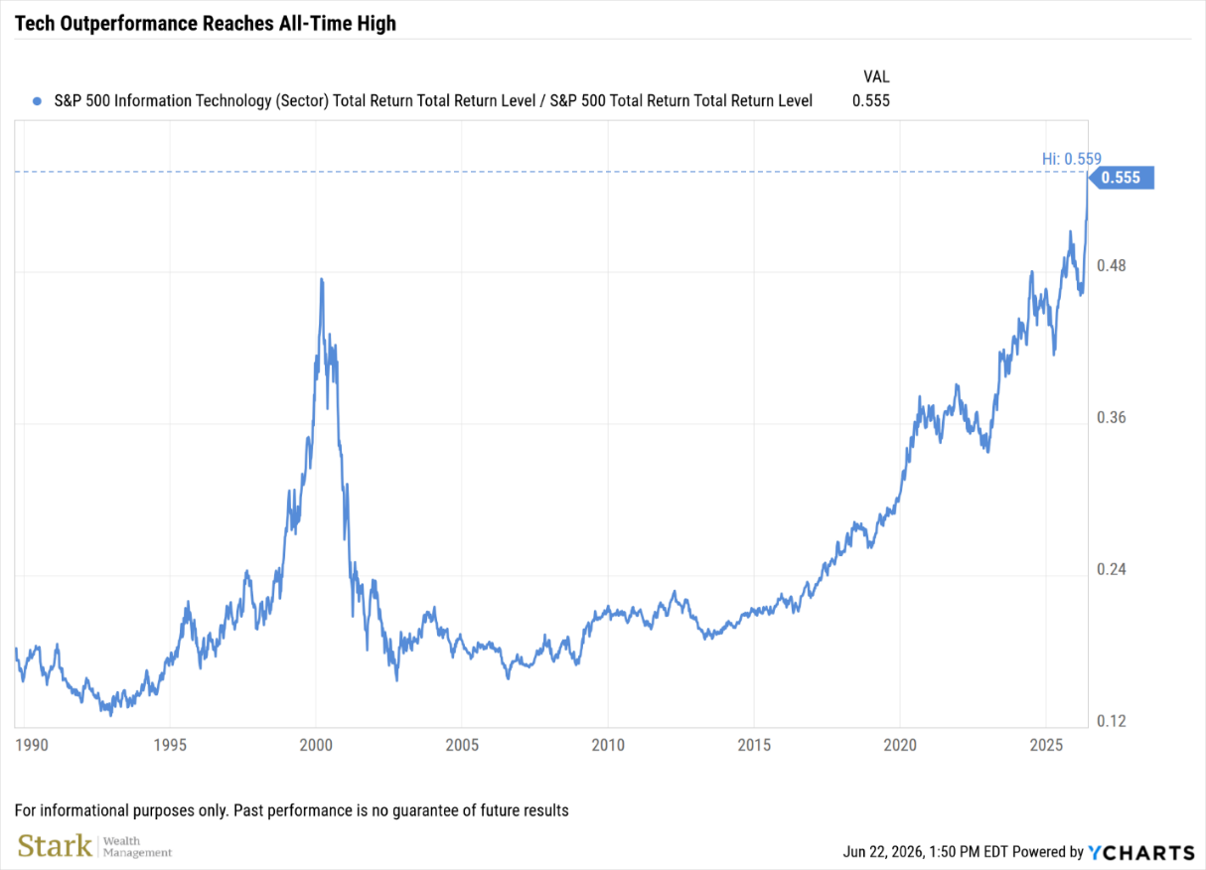
The first half of 2026 also saw Technology maintain its dominant position in the stock market. The sector currently represents 40% of the S&P 500 index and accounted for 55% of the index’s total returns year-to-date. This leadership is not solely a function of performance, but a reflection of the scale and urgency of investment flowing into the sector. A handful of massive technology companies, dubbed the Hyperscalers, continue to drive this outperformance, and their spending decisions are increasingly shaping broader market conditions.
Companies like Microsoft, Google, and Amazon have significantly increased capital spending to expand AI capabilities, shifting investor focus toward identifying which firms are best positioned to benefit across the AI ecosystem. Opportunities for incremental investment are emerging up and down the supply chain. On one end, Hyperscalers are reinvesting operating cash flow into data centers, chips, and cloud infrastructure, while downstream, industrial technology and hardware companies are seeing stronger demand, improved operating leverage, and greater earnings potential.
Concurrently, U.S equity performance has become increasingly tied to sentiment around AI. One of the most pronounced risks for the market today is a bad headline about anything from a tech conference to an IPO. This dynamic reinforces our commitment to a disciplined approach, grounded in expertise rather than reaction. As investors continue to distinguish between companies enabling AI growth and those at risk of disruption, market leadership will likely become more concentrated before it broadens out. Given the duration of the AI-rally, even a modest slowdown in spending by the Hyperscalers could play an outsized role in concentrated U.S equity markets.
New Frontiers in Fixed Income:
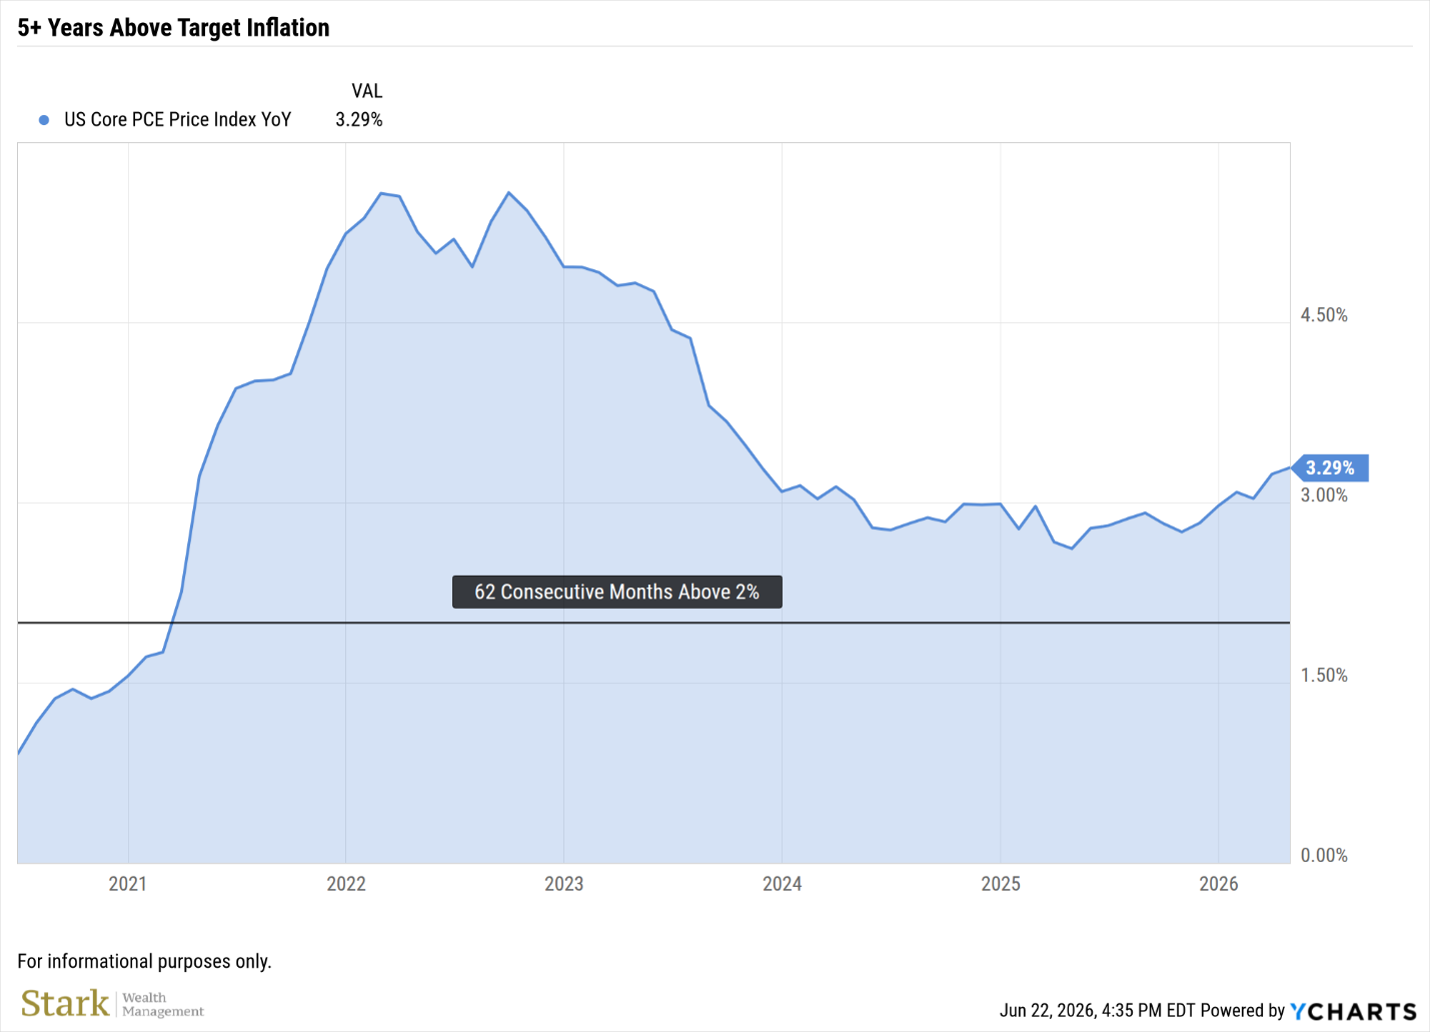
The Federal Reserve’s preferred measure of inflation is the Core Personal Consumption Expenditure (PCE), which excludes more volatile categories such as food and energy to better capture underlying price trends. The PCE reading has been above the Fed’s 2% target for five consecutive years. Persistent above-target inflation, coupled with rising fiscal concerns and a resilient growth backdrop, has led to a repricing of interest rates across developed markets. As a result, bond yields have moved higher and remain elevated, even as credit spreads have tightened.
A credit spread is the difference in yield between a bond that carries credit risk and a comparable risk-free government bond. When spreads are tight, investors receive relatively little compensation for taking on credit risk. As it stands, credit spreads across high-yield and investment-grade markets are historically tight. Meanwhile, starting yields have improved the return outlook for bonds across the board. This suggests a different paradigm for fixed income, in which investors seeking yield are not forced into lower-quality, credit-sensitive assets, as higher-quality bonds now offer more competitive yields.
This fixed income environment helps restore balance in a diversified portfolio. With yields at more attractive levels, bonds can provide both income and stability alongside equities.
Anatomy of Recession:
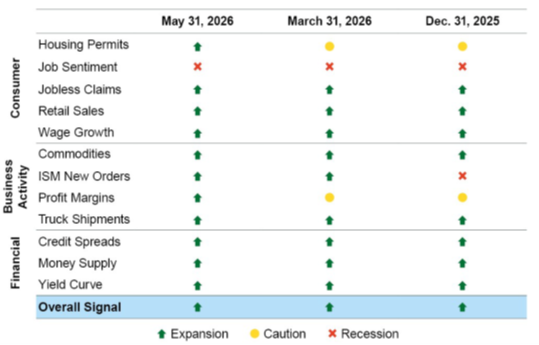
The latest reading of recession indicators continues to point toward ongoing economic expansion, with the overall signal remaining firmly positive as of May 31, 2026. Most categories, including consumer activity, business conditions, and financial markets show broad signs of strength, with improvements in housing permits, jobless claims, retail sales, wage growth, and key business metrics such as new orders and profit margins. While job sentiment remains a notable weak spot, and housing showed some early cautionary signs, most indicators are trending in a constructive direction. Importantly, financial conditions, including credit spreads, money supply, and the yield curve, also remain supportive, suggesting that recession risk, while always worth monitoring, is not an immediate concern. Our biggest takeaway at this time is not about recession, but growth. Current indicators suggest that the US economy has further room to expand.
Although not a crystal ball, leading indicators can provide reliable signals about the upcoming economic environment. Investors should also remember that financial markets and the economy, while linked, do not always work hand-in-hand. Markets can outperform during an economic downturn and vice versa.
Positioning for Volatility:
Investors should prepare for continued market volatility in the coming months, but keep in mind that different portfolios will respond to volatility and risk in different ways. The risk level of a portfolio varies significantly depending on its relative allocation to different areas of the market. Headline risk also plays an increasingly large role in equity markets as retail investors react to media developments about the war in Iran, AI-spending, the path of rates, midterm elections, and other unexpected events.
We always consider your risk tolerance, as well as your investment objective and time horizon, when we allocate your portfolios. We firmly believe that long-term strategic planning, along with tactical rebalances, helps maximize the probability of investors reaching their end goals.
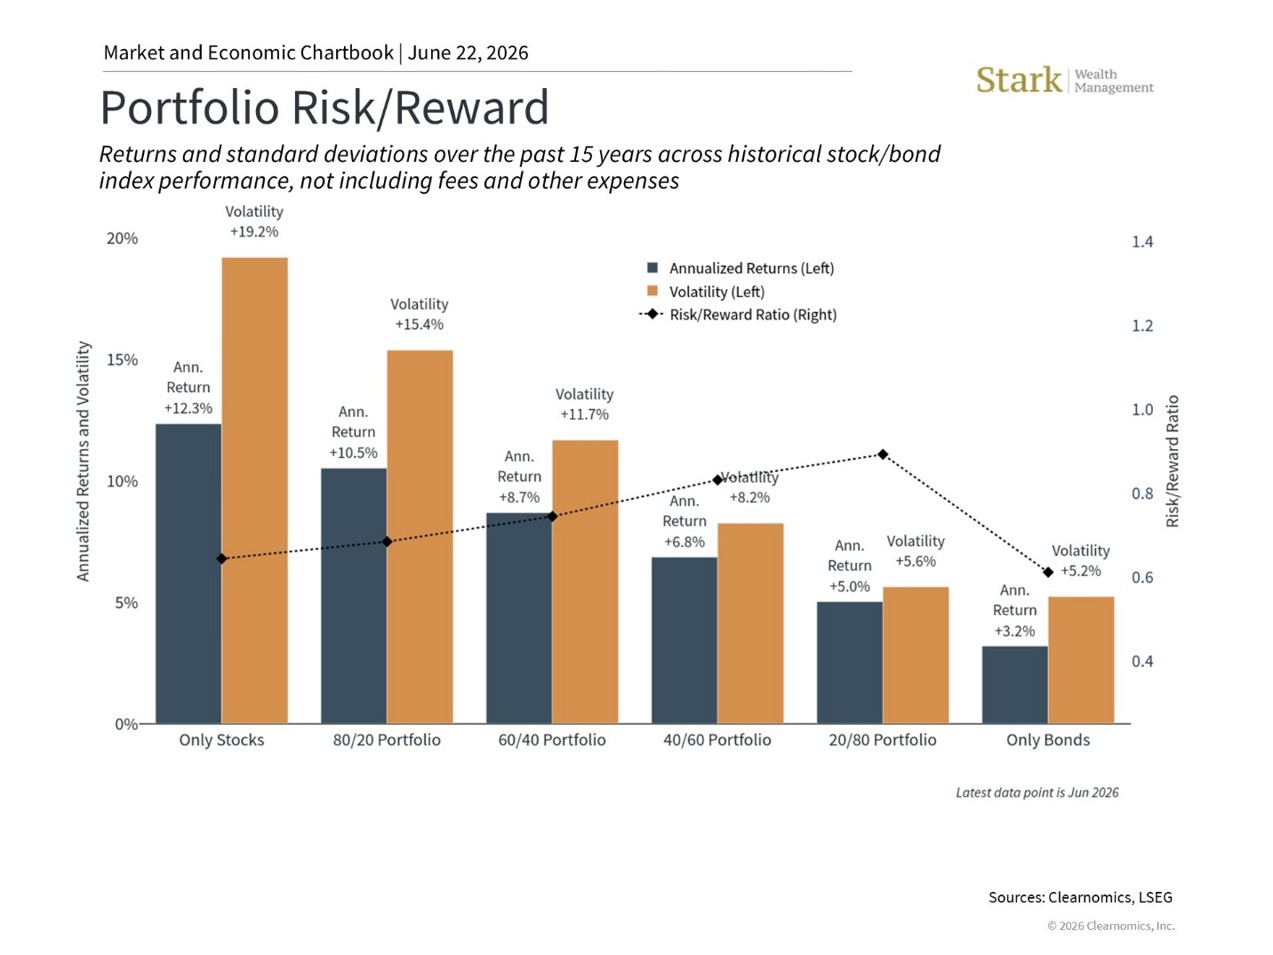
In closing, we remain steadfast in our commitment to long term planning and diversification, and we also recognize that an unpredictable market environment and changing world requires the ability to be nimble and adaptable. Our team has dedicated substantial resources towards our analysis capabilities and technology to execute strategies in minutes. While we don’t hold the crystal ball, we are confident in our ability to monitor portfolios, capitalize on opportunities, and help clients to weather whatever comes next.
References
(n.d.). Retrieved from https://unctad.org/news/hormuz-disruption-deepens-global-economic-strain-across-trade-prices-and-finance
Bureau of Labor Statistics. (2026, 06 10). Consumer Price Index Summary. Retrieved from U.S. Bureau of Labor Statistics: https://www.bls.gov/news.release/cpi.nr0.htm
UN Trade & Development. (2026, April 01). Retrieved from https://unctad.org
Disclosures
This material is for general information only and is not intended to provide specific advice or recommendations for any individual. There is no assurance that the views or strategies discussed are suitable for all investors or will yield positive outcomes. Investing involves risks including possible loss of principal. Any economic forecasts set forth may not develop as predicted and are subject to change.
References to markets, asset classes, and sectors are generally regarding the corresponding market index. Indexes are unmanaged statistical composites and cannot be invested into directly. Index performance is not indicative of the performance of any investment and do not reflect fees, expenses, or sales charges. All performance referenced is historical and is no guarantee of future results.
Any company names noted herein are for educational purposes only and not an indication of trading intent or a solicitation of their products or services. LPL Financial doesn’t provide research on individual equities.
Bonds are subject to market and interest rate risk if sold prior to maturity. Bond values will decline as interest rates rise and bonds are subject to availability and change in price.
The fast price swings in commodities will result in significant volatility in an investor’s holdings. Commodities include increased risks, such as political, economic, and currency instability, and may not be suitable for all investors.
All information is believed to be from reliable sources; however, LPL Financial makes no representation as to its completeness or accuracy.
Because of their narrow focus, sector investing will be subject to greater volatility than investing more broadly across many sectors and companies.
All index data from FactSet or Bloomberg.
This research material has been prepared by LPL Financial LLC.