


First Quarter Analysis- Economic Factors and Market Trends
The first quarter of 2026 reminded investors of a simple truth: markets don’t move in straight lines. Headlines about oil, war, energy prices, jobs, and trade policy may have felt unsettling. Yet beneath the noise, the economy continues to tell a more balanced story—one of slowing momentum, but not necessarily a stall. Growth has cooled, hiring has eased, and certain parts of the market have pulled back, but the foundation remains intact. Understanding these shifts and how they might impact your portfolio doesn’t require a degree in economics—it starts with seeing how everyday forces like employment, consumer spending, and energy costs ripple through the broader economy.
In addition to our prior analysis on oil and geopolitics, we wanted to provide basic takeaways on the larger economic context and factors- from why some sectors are rising while others fall, to how evolving trade policies and tariffs could shape the months ahead.
As investors look ahead to potential changes at the Federal Reserve and an upcoming midterm election, the quarter serves as a timely reminder that market disruptions are inevitable, but disciplined investing remains the most reliable tool for navigating them.
Economic growth is slowing but remains positive

Volatile energy prices are just one piece of the broader economic puzzle. Other signs point to an economy that has cooled over the past year, but that is still fundamentally healthy. This is after many years during which investors and economists predicted recessions that did not materialize.
Perhaps the most closely watched area is the labor market, and the latest payrolls data show that February job gains fell by 92,000 and the unemployment rate edged up to 4.4%. Importantly, job seekers now outnumber job openings for the first time in years. As recently as 2022, there were two job openings for every unemployed individual, reflecting an exceptionally tight labor market. That relationship has now reversed.
However, the context around this matters. Fewer people are entering the workforce due to lower immigration and an aging population. In other words, both the supply and demand sides of the labor market are cooling, which has helped keep the unemployment rate near historically strong levels. Investors tend to watch jobs data closely because employment directly affects household income, consumer confidence, and spending. Consumer spending makes up more than two-thirds of GDP, and has been stronger than many expected over the past several quarters.
Sector performance has diverged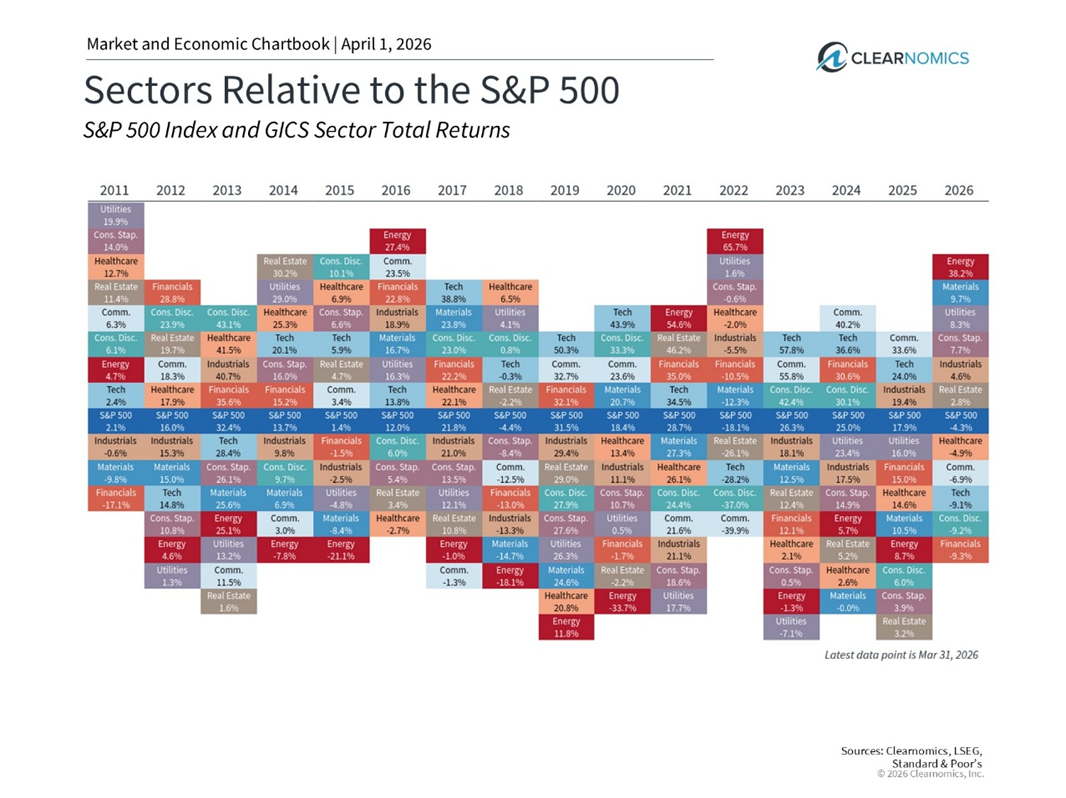
While the overall S&P 500 is experiencing a pullback, performance at the sector level has shown a wide degree of variation. In fact, six of the eleven S&P 500 sectors are positive for the year, and the difference between the best and worst performing sectors widened to nearly 50 percentage points in the first quarter.
The Energy sector has been the clear leader, gaining nearly 40% through the end of March, with higher oil prices expected to boost revenues and encourage further investment. Other sectors showing strength include Consumer Staples, Utilities, Materials, and Industrials, all of which have benefited from a more cautious market environment. Many of these sectors are often considered “defensive,” since they represent more stable businesses with steadier cash flows that are less dependent on the economic cycle.
In contrast, the Information Technology sector has declined approximately 9%, and many mega-cap stocks in the Magnificent 7 have underperformed. This is a shift from recent years when a small number of large technology companies drove the majority of market gains.
As always, it’s important to keep these moves in perspective. As the chart above shows, sector leadership can change based on market and economic conditions. Energy was the best performing sector in 2021 and 2022 when technology-related stocks struggled. This then reversed over the next three years. Just as with asset classes, it is extremely difficult to predict which sector will lead or lag in any given year, which is why a well-balanced portfolio is better positioned to weather different market environments.
The tariff story is evolving

Trade policy also took a turn at the end of January after the Supreme Court ruled 6-3 that the broad tariffs imposed under the International Emergency Economic Powers Act (IEEPA) were unlawful. The administration responded by imposing a temporary global import duty under a different law, Section 122 of the Trade Act of 1974. The administration also opened new Section 301 trade investigations in March, while about a dozen Section 232 investigations remain ongoing.
For investors, the main takeaway is that while the legal basis for tariffs has changed, the broader policy direction will continue. Tariffs will likely continue to impact the economy across consumer prices, business costs, and investor confidence. That said, last year showed that markets adapt to these types of policy changes over time. So, regardless of how the tariff story plays out later this year, the key is to stay invested and not overreact to policy moves.
Content in this material is for general information only and not intended to provide specific advice or recommendations for any individual. All performance referenced is historical and is no guarantee of future results. All indices are unmanaged and may not be invested into directly.
All investing involves risk including loss of principal. No strategy assures success or protects against loss.
The economic forecasts set forth in this material may not develop as predicted and there can be no guarantee that strategies promoted will be successful.
Copyright (c) 2026 Clearnomics, Inc. All rights reserved. The information contained herein has been obtained from sources believed to be reliable, but is not necessarily complete and its accuracy cannot be guaranteed. No representation or warranty, express or implied, is made as to the fairness, accuracy, completeness, or correctness of the information and opinions contained herein. The views and the other information provided are subject to change without notice. All reports posted on or via www.clearnomics.com or any affiliated websites, applications, or services are issued without regard to the specific investment objectives, financial situation, or particular needs of any specific recipient and are not to be construed as a solicitation or an offer to buy or sell any securities or related financial instruments. Past performance is not necessarily a guide to future results. Company fundamentals and earnings may be mentioned occasionally, but should not be construed as a recommendation to buy, sell, or hold the company's stock. Predictions, forecasts, and estimates for any and all markets should not be construed as recommendations to buy, sell, or hold any security--including mutual funds, futures contracts, and exchange traded funds, or any similar instruments. The text, images, and other materials contained or displayed in this report are proprietary to Clearnomics, Inc. and constitute valuable intellectual property. All unauthorized reproduction or other use of material from Clearnomics, Inc. shall be deemed willful infringement(s) of this copyright and other proprietary and intellectual property rights, including but not limited to, rights of privacy. Clearnomics, Inc. expressly reserves all rights in connection with its intellectual property, including without limitation the right to block the transfer of its products and services and/or to track usage thereof, through electronic tracking technology, and all other lawful means, now known or hereafter devised. Clearnomics, Inc. reserves the right, without further notice, to pursue to the fullest extent allowed by the law any and all criminal and civil remedies for the violation of its rights.